
All work
DataOpen source
Födelsedata från SCB
Interactive visualisation of Sweden's birth statistics 2016 to 2020: table, chart and municipality map.
The brief
Statistics Sweden has open data, but most people stop at a table. The idea was to fetch birth data through SCB's API and make it explorable by year, sex and municipality without having to understand the API.
How it was built
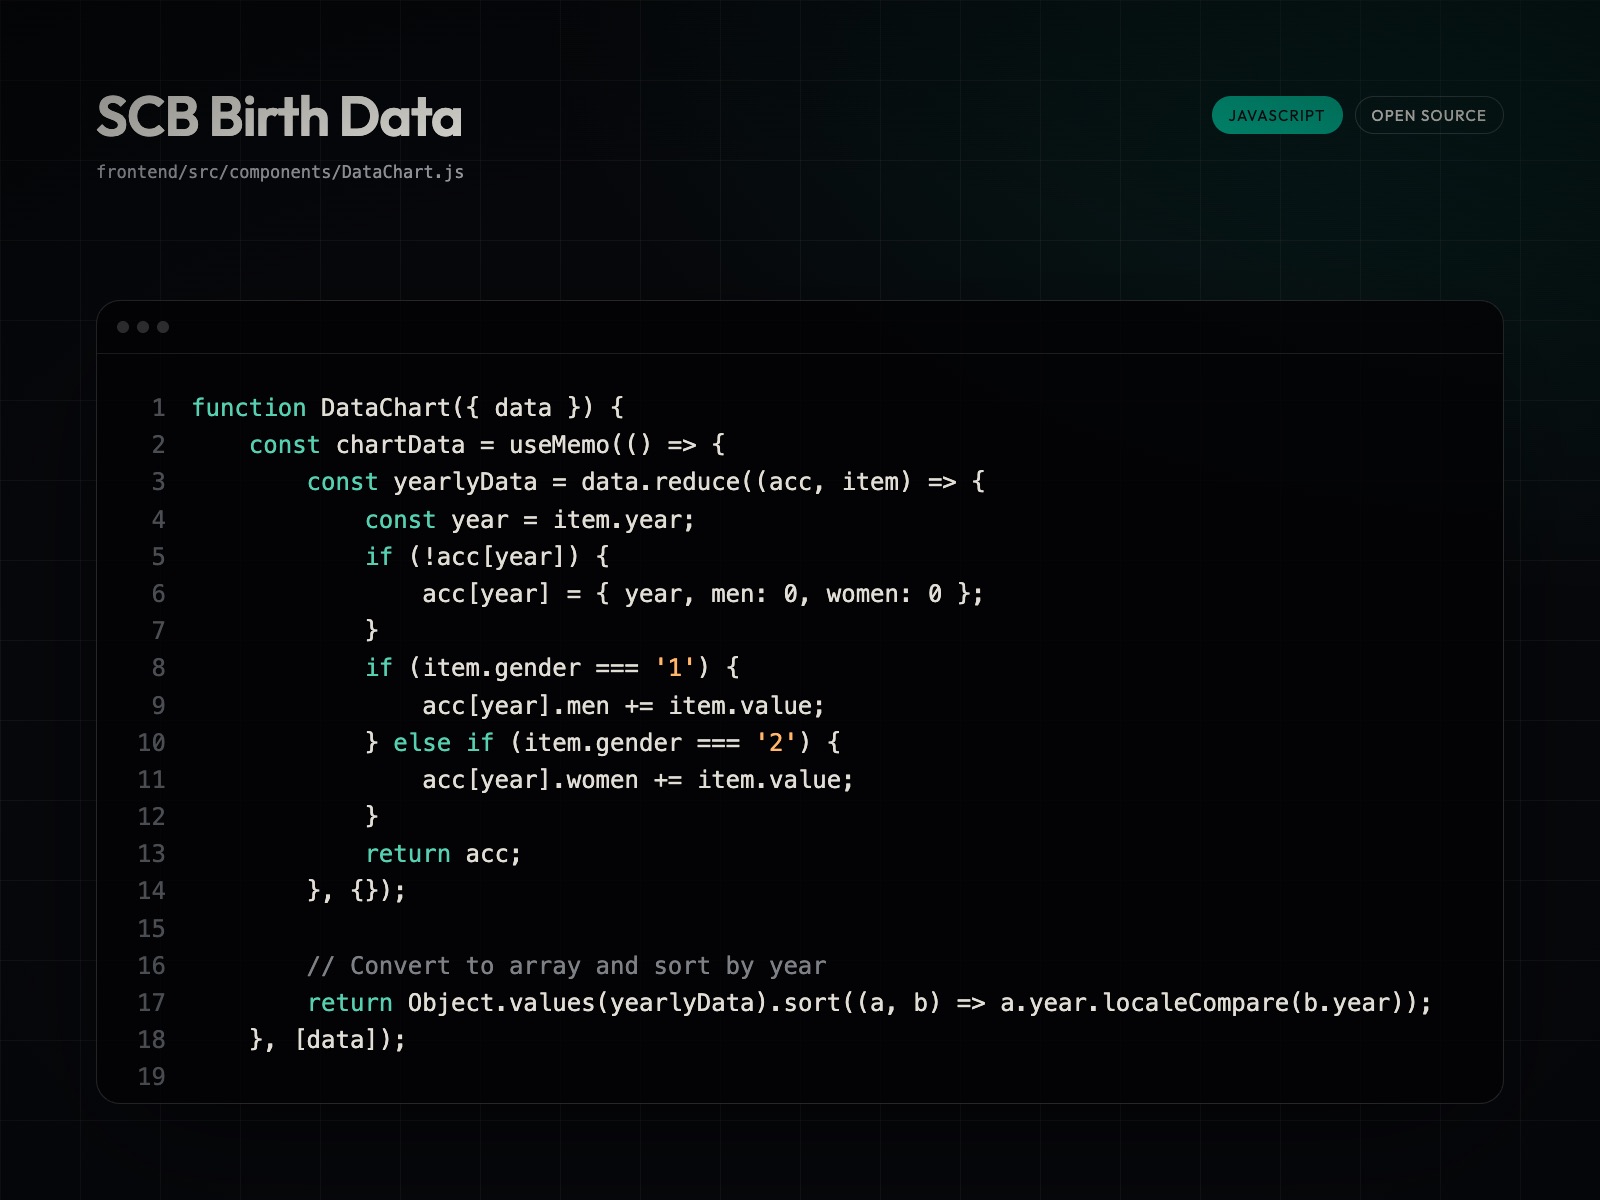
A Node backend fetches and caches the data in MongoDB and exposes it to a React front end. Data is shown as a table, a Recharts line chart and a map of Sweden's municipalities drawn from GeoJSON, with dark mode and a refresh action that pulls fresh data from SCB.
What was built
- Fetching and caching of SCB data
- Table, line chart and municipality map
- Municipality mapping and coordinates
- Dark mode
Where it stands
Open source on GitHub.
Time to build something worth visiting.
Describe the project and get a straight answer on scope, timeline and price.
Or email directly at hello@goatrikworks.com